Understand-Anything: Turn Any Codebase Into a Map
Inheriting legacy code or onboarding to a massive codebase means hours lost in grep and file trees. Understand-Anything generates knowledge graphs that visualize how components connect, what layers exist, and where business logic lives. We cover the workflow, cost trade-offs, and how it compares to token-efficient alternatives like CodeGraph.
You've just inherited a 200,000-line legacy system. No documentation. No diagrams. The original team is gone. Your manager needs a security audit by Friday.
Grep finds function names. Your IDE shows file trees. Neither tells you how authentication flows through six microservices or where the payment logic actually lives. You're reading code blind.
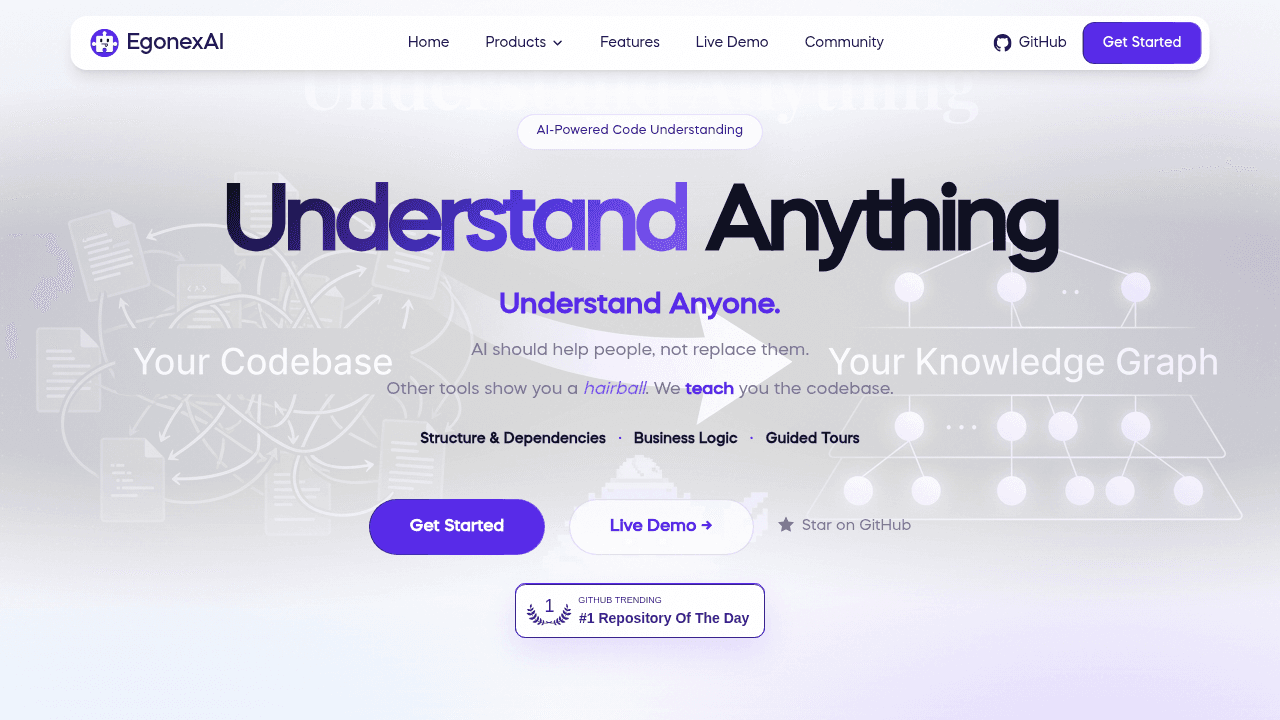
Understand-Anything generates interactive knowledge graphs from any codebase—nodes for classes, edges for dependencies, layers for architecture. One /understand command produces a queryable map that shows not just what exists, but how it all connects.
The Problem: Reading Code Blind
Joining a new team. Reviewing a massive pull request. Auditing third-party code. Traditional tools show trees but not forests. File browsers reveal folder structure. Search finds symbol definitions. Documentation—if it exists—describes isolated components but rarely explains the system.
The tool addresses this by analyzing every file, function, class, and dependency, then presenting them in a visual dashboard where you can see the big picture. Instead of hunting through directories, you get a map of how components fit together.
What the Artifact Actually Looks Like
The core output is a typed, directed knowledge-graph JSON file containing nodes, edges, layers, and guided tours—validated with Zod schemas for type safety. It's not an abstract syntax tree dump or static documentation. It's structured data that maps code to real business domains, processes, and flows so humans and AI can query it.
Think of it as turning source code into a database you can ask questions about: "What depends on the authentication module?" or "Which services touch customer payment data?"
The Workflow: Generate Once, Query Forever
Run /understand in your terminal. The tool analyzes your repository and generates the graph. Inspect it in the visual dashboard. Then commit the JSON artifact to version control.
That last step matters: teammates can skip re-analysis and use the graph for onboarding and pull request reviews. The tool integrates with Claude Code, Cursor, GitHub Copilot, and Gemini CLI, so you can query the graph during development without leaving your editor.
Who This Serves
Staff engineers navigating multi-repo systems. Tech leads reviewing architecture before a refactor. Developers onboarding to teams with no ramp-up documentation. If you regularly face large, unfamiliar codebases where understanding structure is as important as reading individual functions, this tool saves hours.
For small projects or solo work on 500-line scripts? Traditional tools suffice. This is overkill unless the codebase is genuinely complex.
The Cost Question
A Reddit thread raised the concern honestly: the plugin requires a Claude Max subscription, which some developers find expensive. It's a real trade-off. If you're drowning in unfamiliar code monthly—inheriting legacy systems, auditing dependencies, onboarding to new teams—the time saved may justify the cost. If not, cheaper alternatives exist.
CodeGraph vs. Understand-Anything
CodeGraph focuses on token-efficient indexes for AI agents—minimal overhead, optimized for machine consumption. Understand-Anything optimizes for human comprehension: visual, teaching-oriented graphs that explain architecture.
Both approaches are valid. The choice depends on whether you're feeding context to agents or teaching developers how a system works.
Real-World Momentum
The repository hit #1 on GitHub Trending, collecting tens of thousands of stars. The project is actively maintained with a recent v2.7.3 release, and teams are committing artifacts for onboarding and reviews—evidence it's solving real problems beyond demo hype.
When to Reach for This
You're inheriting a microservices mesh with no architecture diagrams. You're joining a team with zero ramp-up docs. You're auditing a third-party library for security vulnerabilities. If the codebase is large, unfamiliar, and critical, the knowledge graph pays for itself in saved exploration time.
If the codebase is small, well-documented, or familiar? Stick with grep and your IDE. But when you're staring at a maze, having a map changes everything.
Egonex-AI/Understand-Anything
Graphs that teach > graphs that impress. Turn any code into an interactive knowledge graph you can explore, search, and ask questions about. Works with Claude Code, Codex, Cursor, Copilot, Gemini CLI, and more.